Creating Grafana dashboards with Golang
This post is to present the little library I made to create grafana dashboards from my tool nom2influxdb.
Grafana REST API
Grafana API is really great. It’s pretty flexible and forgiving. I will not say this library cover all dashboard settings it’s possible to set or all customizations but it cover enough of them for my use cases and I am really interested by feedbacks to find how to improve it. My tool nmon2influxdb use it to generate all the dashboards.
gist and documentation
I made my test code available in this gist: grafanaclient_demo.go.
In the following post I will skip the error checks to make the core more readable but they are included in the gist itself.
The full library documentation is available on godoc.
installation
I assume golang is installed and working well. Else you can go(^^) here: https://golang.org/doc/install.
Install my grafana client library:
go get github.com/adejoux/grafanaclientconnection
Let’s initialize a session with grafana:
package main

import (
	"github.com/adejoux/grafanaclient"
)

func main() {

	// account credentials and url to connect to grafana
	user := "admin"
	pass := "admin"
	url := "http://192.168.56.101:3000"

	// create Grafana session
	session := grafanaclient.NewSession(user, pass, url)

	// logon on the current session
	session.DoLogon()

}
You only need to import my grafanaclient library.
NewSession method initialize the http session to talk with Grafana. DoLogon performs the login itself.
Note: I am still wondering if I should merge the two methods in one. Let me know what you think. :)
create a datasource
A datasource allows to define where to find the data to display in Grafana. Each panel in Grafana can have a different datasource.
Let’s create a test datasource using InfluxDB:
// define a new datasource
ds := grafanaclient.DataSource{Name: "testdata",
  Type:     "influxdb",
  Access:   "proxy",
  URL:      "http://192.168.56.101:8086",
  User:     "root",
  Password: "root",
  Database: "testdb",
}

// create the new datasource
session.CreateDataSource(ds)
The only parameter which is maybe not obvious is Access. It specify if the requests to the datasource will be performed from your browser or by the grafana server itself. When setup on proxy, the grafana server instance will perform the requests. So you can secure your database setup by allowing only connections from it.
After creating the datasource, we can list all the existing datasources defined in our Grafana instance:
// let's list the existing data sources
dataSources, listErr := session.GetDataSourceList()
if listErr != nil {
  log.Fatal(listErr)
}

for _, dataSource := range dataSources {
  fmt.Printf("name: %s type: %s url: %s\n", dataSource.Name, dataSource.Type, dataSource.URL)
}
The output should be something like that:
name: testdata type: influxdb url: http://192.168.56.101:8086And you will be able to see it in the datsource section of Grafana:

Dashboard creation
This library can import most of the existing dashboards in json format. But here let’s create a dashboard from scratch in Golang.
// init a new dashboard and allows edition
dashboard := grafanaclient.Dashboard{Editable: true}

// let's set the title
dashboard.Title = "test dashboard"
rows
Each dashboard is composed of rows and each row is composed of panels.
// Creating a new row
textRow := grafanaclient.NewRow()
textRow.Title = "this row will contain only a text panel"
textRow.Collapse = true // it will be collapsed by default

// let's create a simple text panel supporting html format
textPanel := grafanaclient.Panel{Type: "text", Editable: true, Mode: "html"}

// Add some content
textPanel.Content = "<b> Hello World</b>"

// and add the panel to the row
textRow.AddPanel(textPanel)

// add the row to the dashboard itself
dashboard.AddRow(textRow)

// Setup time frame
dashboard.SetTimeFrame(time.Now().Add(-24*time.Hour), time.Now())

//upload the dashboard
session.UploadDashboard(dashboard, true)
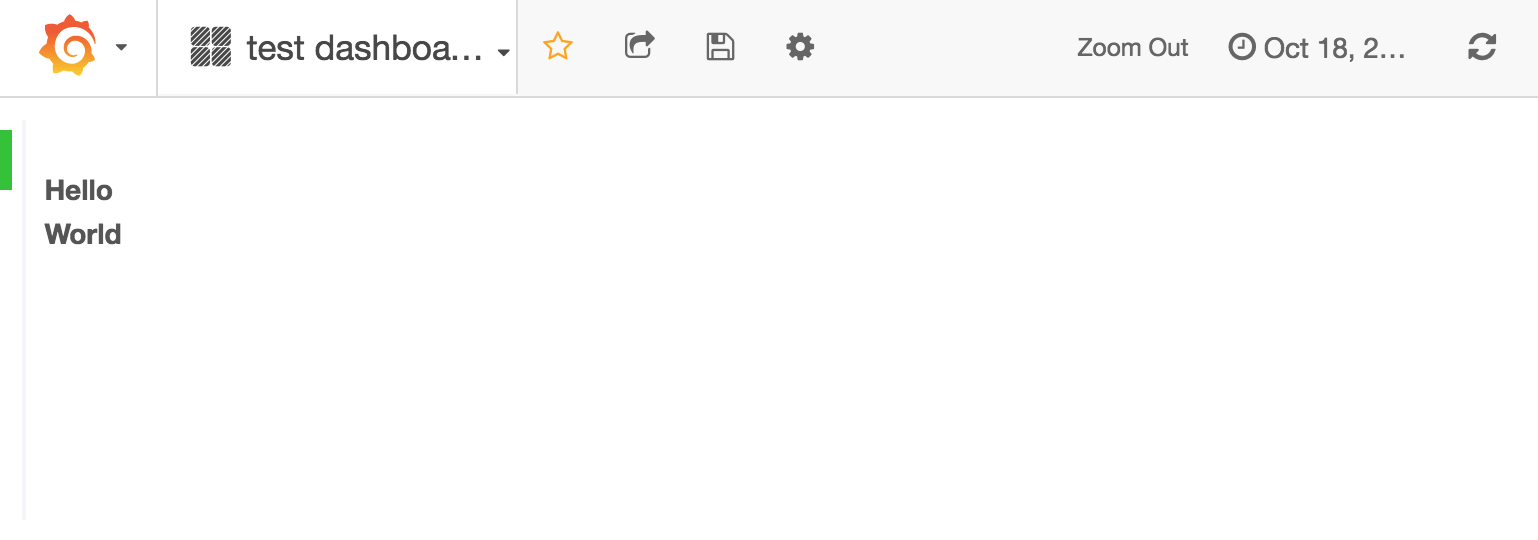
In this example, I add a simple text panel and I collapse the row by default.
After creating the panel, it’s added to the row and the row itself is added to the dashboard.
Here it’s not strictly mandatory but it’s better to add a timeframe to the dashboard with SetTimeFrame method.
The last step is to upload the dashboard on the Grafana instance with UploadDashboard.
The result will be:

graph panels
I will create a graph panel to display the CPU_ALL measurement on server test using the datasource we created previously.
//create a new row with charts
graphRow := grafanaclient.NewRow()
graphRow.Title = "charts"

// NewPanel will create a graph panel by default
graphPanel := grafanaclient.NewPanel()

// set panel title
graphPanel.Title = "chart1"

// let's specify the datasource
graphPanel.DataSource = "testdata"

// change panel span from default 12 to 6
graphPanel.Span = 6

// stack lines with a filling of 1
graphPanel.Stack = true
graphPanel.Fill = 1
Until now, it’s really similar to creating a text panel. We are specifying the datasource used by this panel. And change some display options like the panel length with Span. We also specify we want to stack all lines and have a filling of depth 1 between them.
The queries itself are defined in a Target structure.
// define a target
target := grafanaclient.NewTarget()

//specify the measurement to use
target.Measurement = "CPU_ALL"

// group stats by name tag values
target.GroupByTag("name")
target.GroupByTag("host")

// filter by host tag
target.FilterByTag("host", "test")
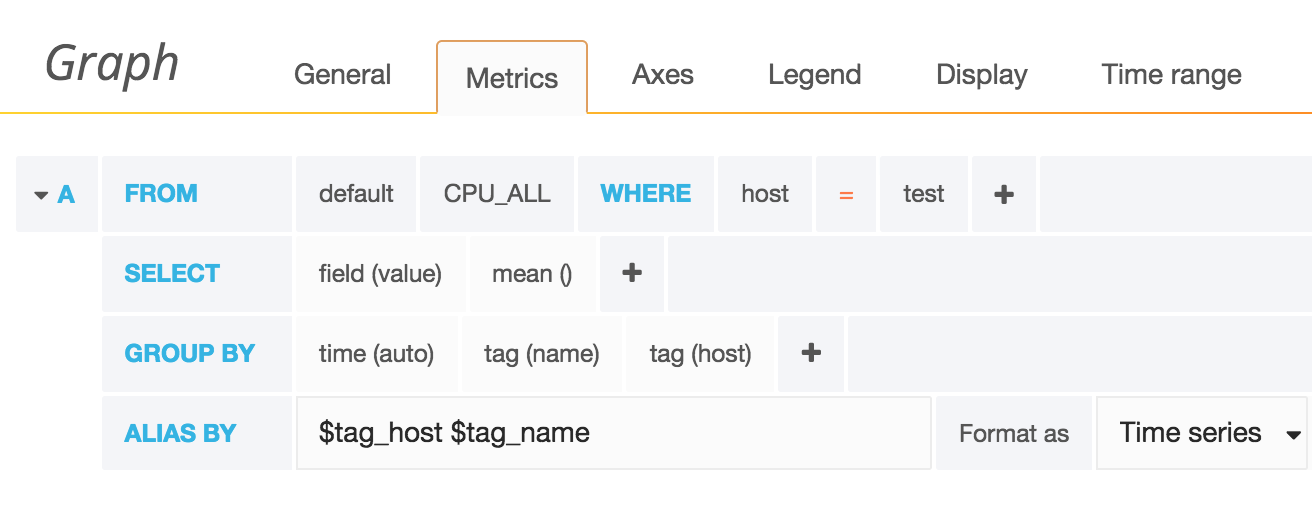
It will generate this query in the dashboard:

The aliases are setup automatically to “$tag_host $tag_name”, if you want to change them, you can by changing the Alias value:
// define a new alias
target.Alias = "mynewalias"
Same for the datasource type, it’s set to InfluxDB by default but it’s possible to change it:
// define a new alias
target.DSType = "influxdb"
It’s also possible to customize the graph legend:
legend := grafanaclient.NewLegend()
legend.Values = true
legend.Min = true
legend.Avg = true
legend.Max = true
legend.AlignAsTable = true
panel.Legend = legend
Ending
I didn’t cover everything you can do with this library. It’s also possible to generate table panels, import existing dashboards or import dashboards written in toml. I hope you will find this library helpful and to receive feedbacks and ideas for improvement. :) I already made some improvements to the library itself when writing this article. So it’s worthy. :)