ganglia optional graph
A little post showing how to add a new optional graph in ganglia web interface.
I use ganglia mainly on AIX. So the main resources are the ones provided on http://www.perzl.org.
The new web interface is a big improvement :
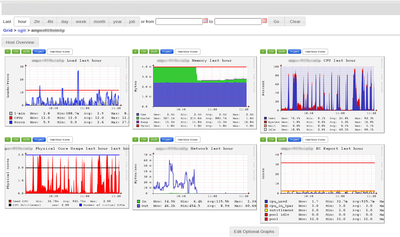
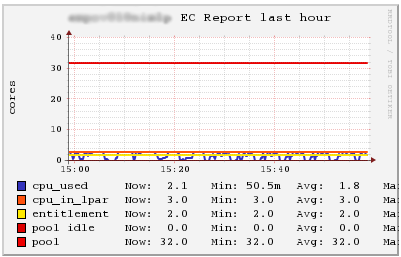
I wanted a graph displaying the following informations :
To define a simple report in the web interface, the best way is to create a json file in graph.d directory. This directory is located in the folder where you deployed the web interface.
Here the file content :
{
   "report_name" : "ec_report",
   "report_type" : "standard",
   "title" : "EC Report",
   "vertical_label" : "cores",
   "series" : [
      { "metric": "cpu_used", "color": "3333bb", "label": "cpu_used", "line_width": "2", "type": "line" },
      { "metric": "cpu_in_lpar", "color": "ff530d", "label": "cpu_in_lpar", "line_width": "2", "type": "line" },
      { "metric": "cpu_entitlement", "color": "ffea00", "label": "entitlement", "line_width": "2", "type": "line" },
      { "metric": "cpu_pool_idle", "color": "dd0000", "label": "pool idle", "line_width": "2", "type": "line" },
      { "metric": "cpu_in_pool", "color": "ee0000", "label": "pool", "line_width": "2", "type": "line" }
   ]
}
It’s pretty straight forward. It’s possible to specify stack type instead of line to stack the values.
After that, we enable the report by clicking on “Edit optional graphs” :
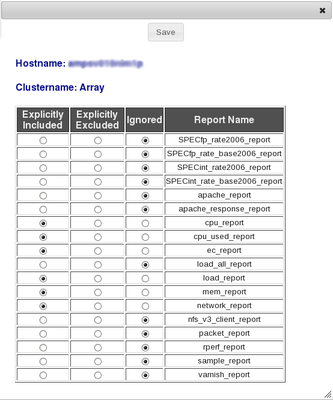
Or modifying the default.json file in conf directory.
{
        "included_reports": ["load_report","mem_report","cpu_report", "cpu_used_report", "ec_report", "network_report"]
}
That’s all :)