nmon2influxdb stats for large systems
I developed this tool because I didn’t find anything allowing me to analyze systems with a lot of disks. By a lot, I means above 150 hdisks on AIX. I meet a lot of customers which have systems with a lot more disks. And it was always bothering me to not be able to perform a good disk performance analysis on their systems.
I will show you what the tool can do with a vio server with 2464 hdisks and 616 hdiskpowers.
disclaimer
If possible, you should try to not have too many disks on your system. On a aix system, I am happy with less than 20 disks. I have seen a lot of environments and I know it’s not easy to keep this kind of rules but you should really try.
MPIO is really great on AIX. Paths are a lot lighter than disks.
For information, this system was migrated on Shared Storage Pool to solve the issue of having so many disks and allowing Live Partition Mobility between systems.
tested system configuration
It’s a vio server using powerpath. For each pseudo disk hdiskpower, it has 4 paths. So for each lun mapped on the vio server, the system see 5 disks :
==== START powermt display Wed Aug 12 16:26:17 CEST 2015 ====
Symmetrix logical device count=616
CLARiiON logical device count=0
Hitachi logical device count=0
HP xp logical device count=0
Ess logical device count=0
Invista logical device count=0
==============================================================================
----- Host Bus Adapters ---------  ------ I/O Paths -----  ------ Stats ------
###  HW Path                       Summary   Total   Dead  IO/Sec Q-IOs Errors
==============================================================================
   0 fscsi0                        optimal    1232      0       -     1      0
   1 fscsi2                        optimal    1232      0       -     2      0
Pseudo name=hdiskpower2
Symmetrix ID=000999999997
Logical device ID=09FE
state=alive; policy=SymmOpt; priority=0; queued-IOs=0;
==============================================================================
--------------- Host --------------- - Stor - -- I/O Path -- -- Stats ---
### HW Path I/O Paths Interf. Mode State Q-IOs Errors
==============================================================================
1 fscsi2 hdisk1613 FA 8fB active alive 0 0
1 fscsi2 hdisk278 FA 6fB active alive 0 0
0 fscsi0 hdisk4 FA 9fB active alive 0 0
0 fscsi0 hdisk591 FA 11fB active alive 0 0For information, it’s a vios serving 130+ client partitions. Each partition has at least 3 hdisks(rootvg,appvg, toolvg).
disks stats
It’s not possible to display so much disks in a chart. I will show you later what Grafana can do.
The solution I found was to perform statistics on this disks based on a time frame.
For example if I want the top 20 DISKWRITE disks for all disks, I can run this command :
nmon2influxdb stats -m DISKWRITE -s pavio1 -f "07:00:00,10-Aug-2015" -t "19:00:00,17-Aug-2015" -l 20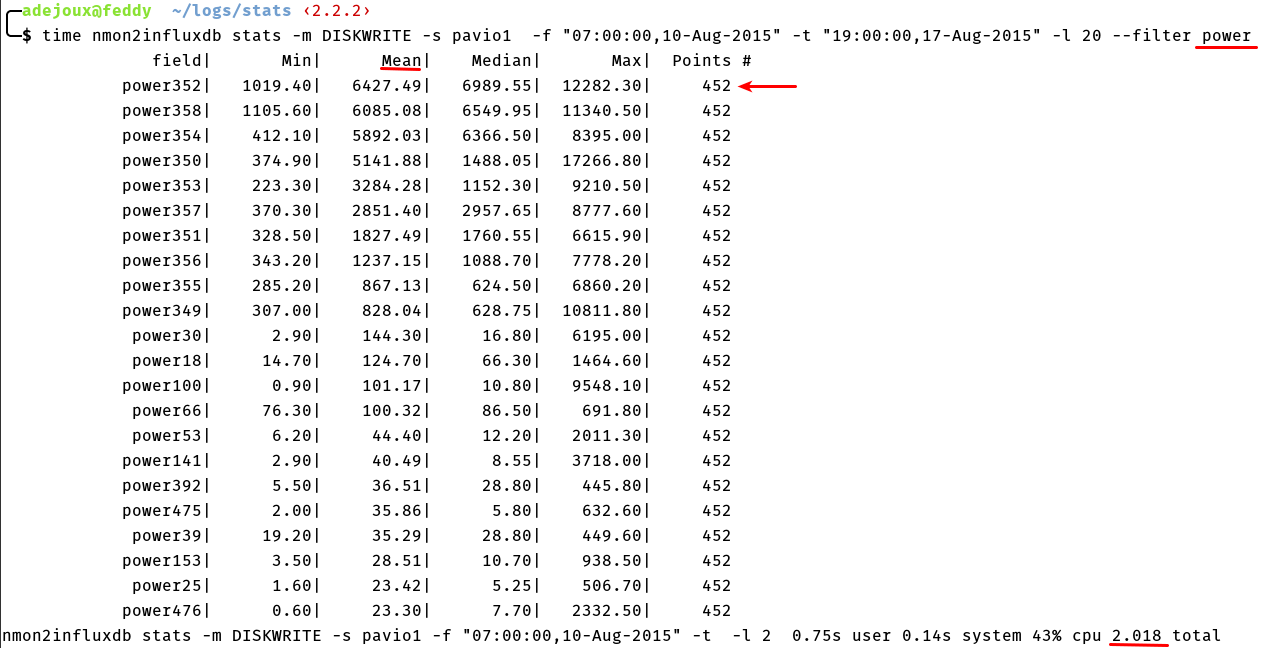
The points indicates how many performance values was found for the disk. Normally it should be the same for each disk but it can change if you take a time frame matching multiple nmon reports and some disks was added or removed.
And it’s also explaining why I coded my tool in golang. I need speed for this calculation. In the example above, I have 452 values on 3080 disks. It’s 1 392 160 measures to compute. It would have been too slow in python or ruby without a C extension. Golang is a perfect fit here.
We are seeing hdiskpower and normal hdisk ixed in the output, the –filter parameter will allow us to have only the power disks. And performance will be better because it will only fetch statistics for 616 disks instead of 3080.
nmon2influxdb stats -m DISKWRITE -s pavio1 -f "07:00:00,10-Aug-2015" -t "19:00:00,17-Aug-2015" -l 20 --filter 'power'By default it’s sorted by mean value. You can change it with the –sort option.
I am using the -l option to get only the top 20 disks. Computation is done on the total of the disks remaining after the filtering.
Unfortunately the hdiskpower pseudo-devices don’t have any statistics for service time.
So if i want the disk read service time, I need to perform the query on the standard AIX devices only.
nmon2influxdb stats -m DISKREADSERV -s pavio1 -f "07:00:00,10-Aug-2015" -t "19:00:00,10-Aug-2015" -l 20 --filter 'hdisk\d'And here the result :
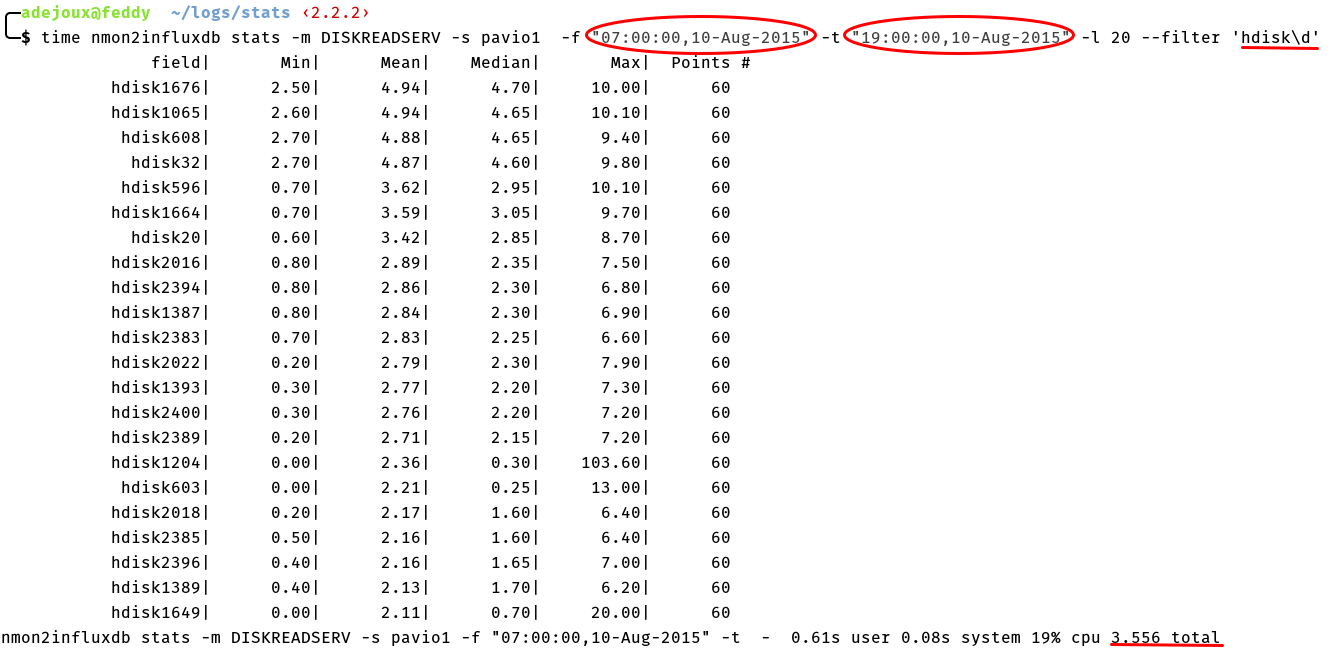 It’s still possible to find the LUN behind. It’s just taking more time.
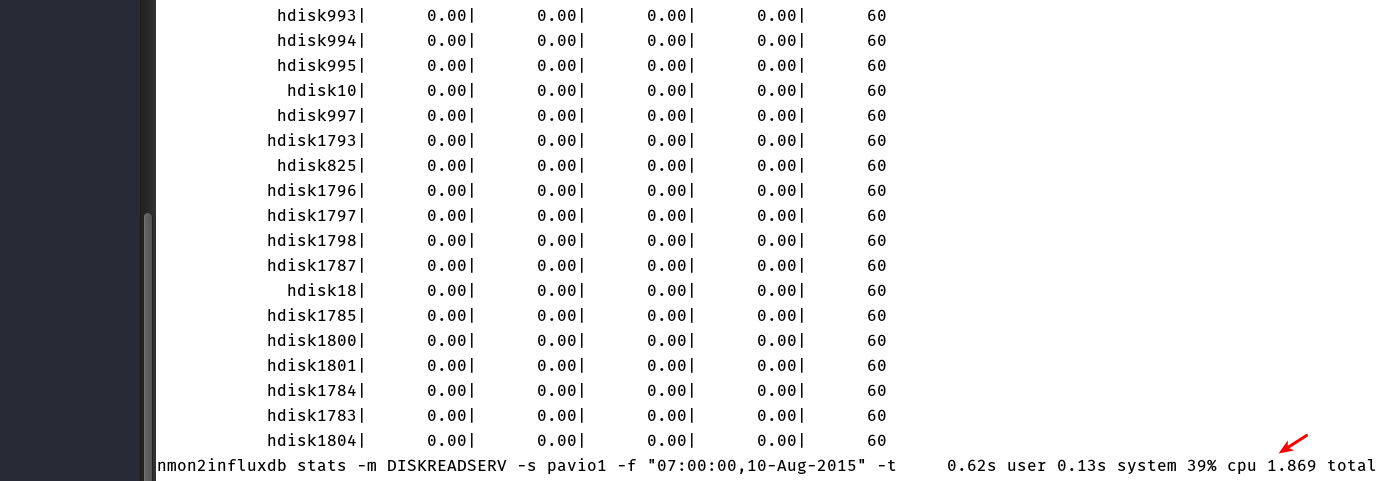
For information, the processing time is almost the same if you are not limiting the output(no way to sort disks without calculating stats for every disks) :
nmon data in InfluxDB
nmon2influxdb is creating one time serie by disk and host name. It’s why the number of disks or systems stored doesn’t matters.
Here a illustration :
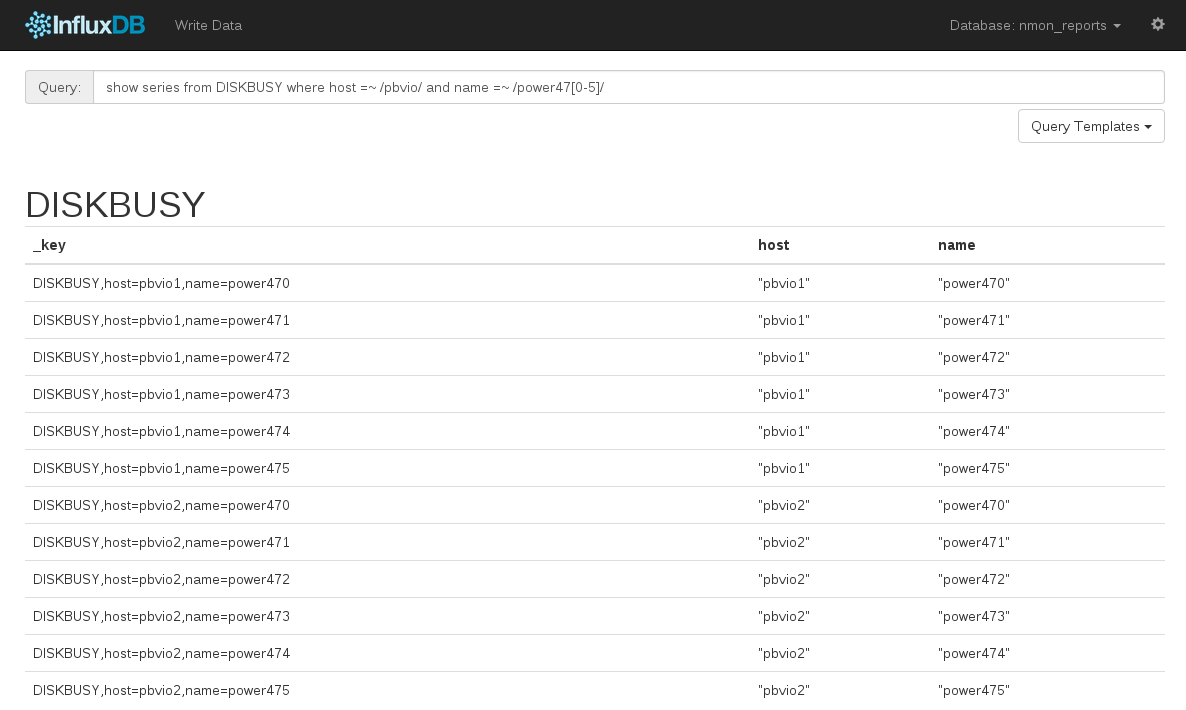
The query system of InfluxDB is really powerful. Use regular expressions.
So no chart ?
To be honest I tried :) I displayed the 616 hdiskpower in Grafana :
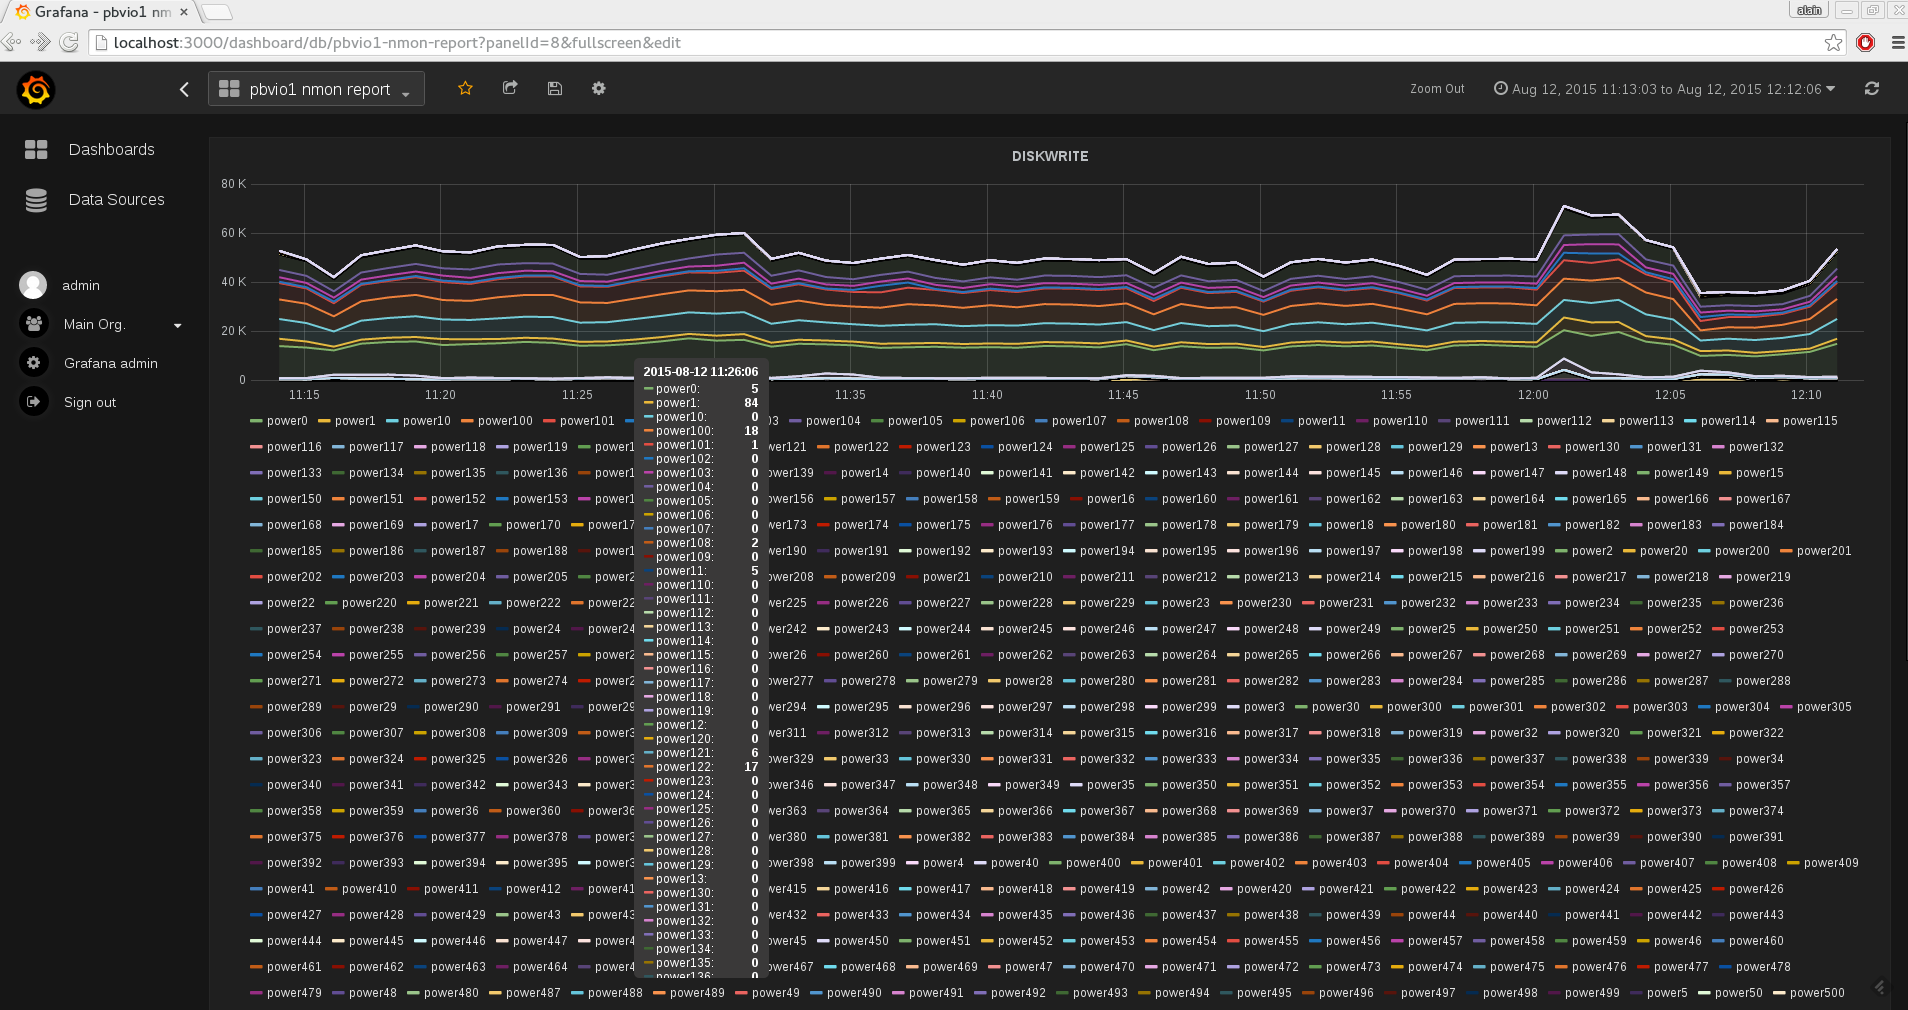
It’s impressive to see it was working. Changing parameters or time frame took dozens of seconds instead of being almost immediate but it worked :) I think it’s because we was moving a lot of system to SSP so a lot of hdiskpower was doing nothing. Still impressive performance from Grafana/InfluxDB :)
It’s still useless for analysis. It’s better to select only some hdiskpower with the powerful query system. Here I selected the hdiskpower used by our Shared Storage Pool :
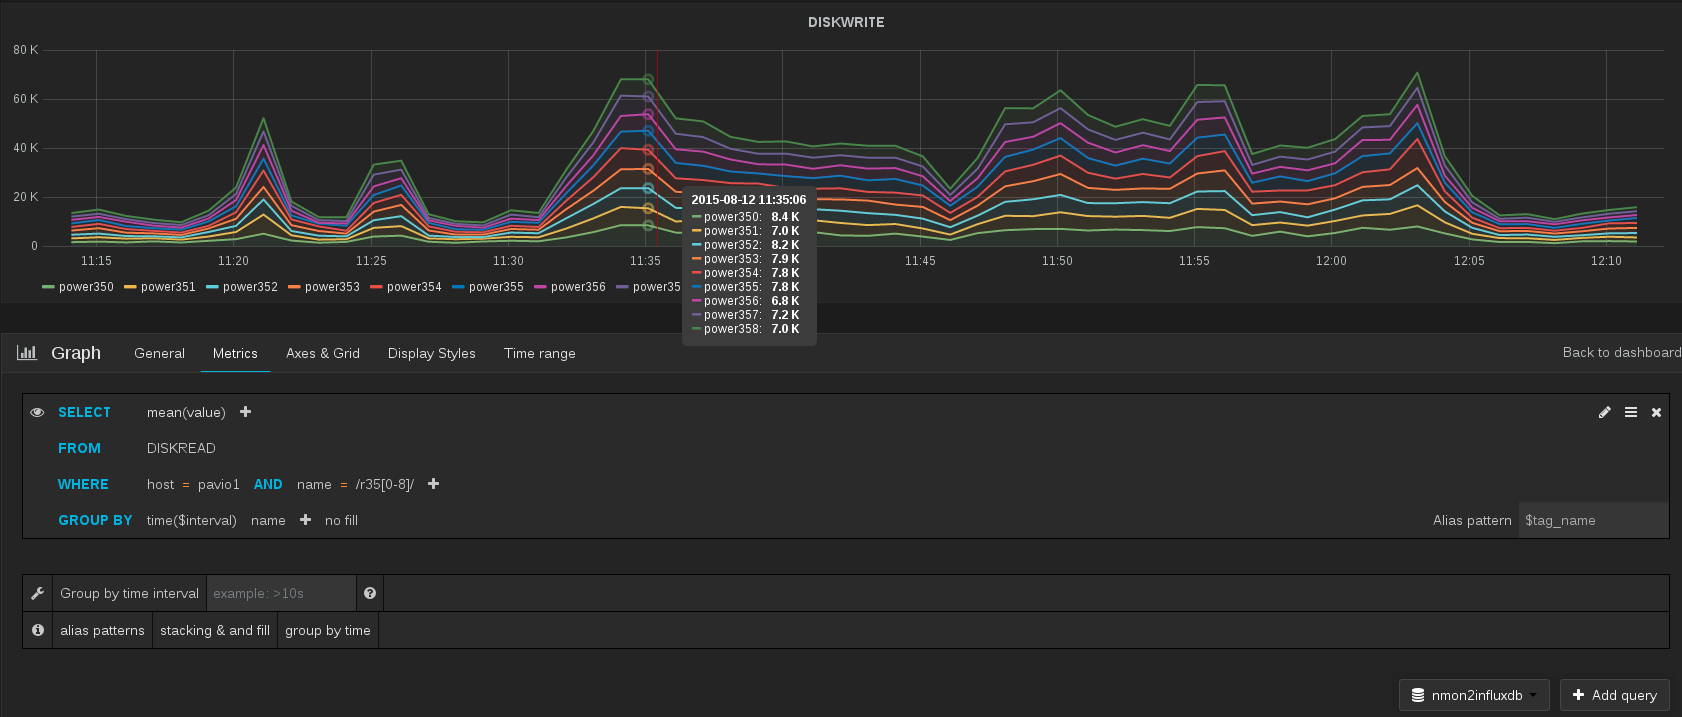
The query editor is really great. It’s showing you the expected results when you are typing your regular expression :
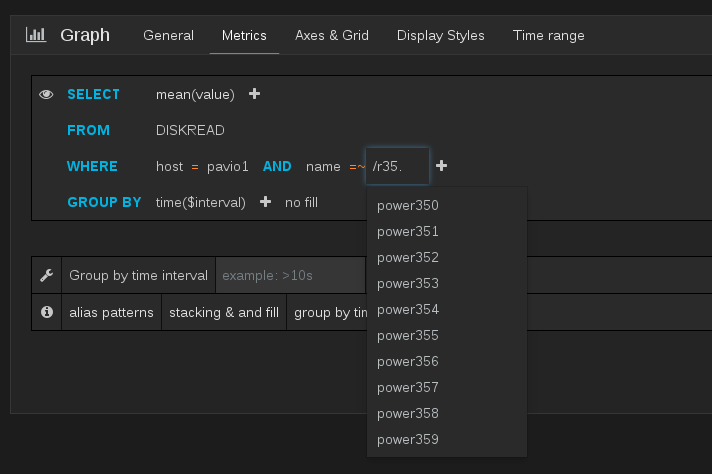
You can use the same regular expression in nmon2influxdb stats :

conclusion
I hope I made you want to test this tool :)