nmon2influxdb installation on Windows
In this post, I will describe how to install and run nmon2influxdb on Windows. I will install docker-toolbox to setup an environment where InfluxDB and Grafana are available for my tool.
description
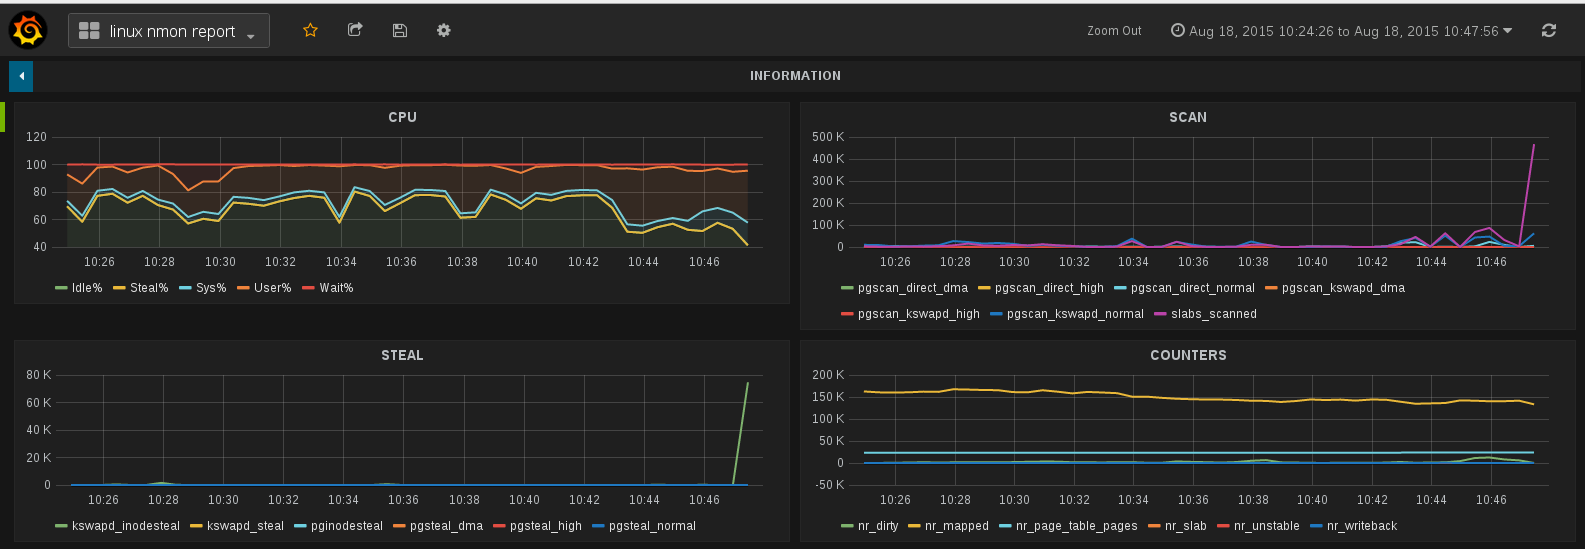
InfluxDB is the tool I made to analyze NMON reports on my linux laptop.
It’s importing NMON data in InfluxDB and generate Grafana dashboard to visualize them.
The project description is available here.
nmon2influxdb installation
nmon2influxdb installation itself is pretty easy. it’s only one binary file.
You can download the latest version in the release section of nmon2influxdb repo.
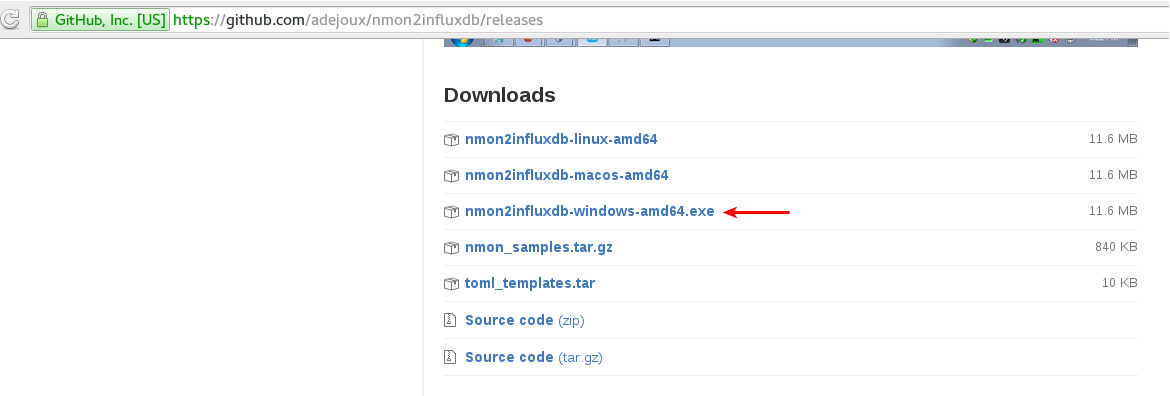
You can put the binary where you want.
docker-toolbox installation
docker-toolbox is packaging Docker to make it available easily on Windows.
You download a simple installer on docker-toolbox
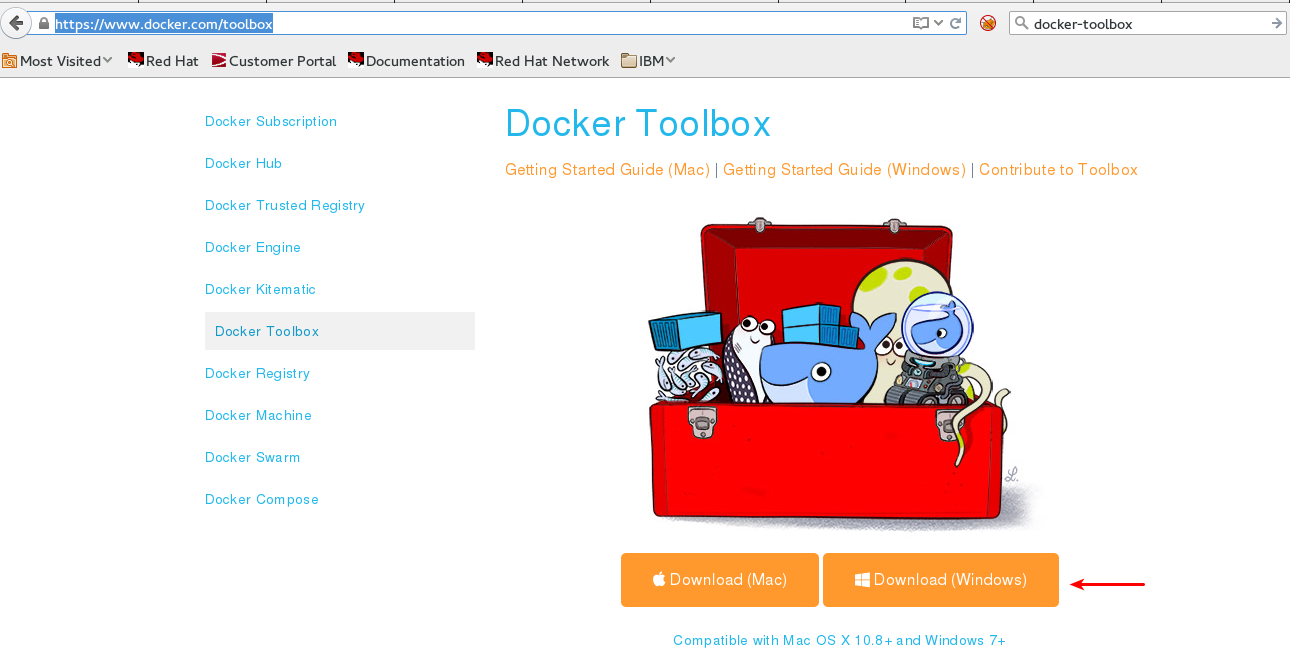
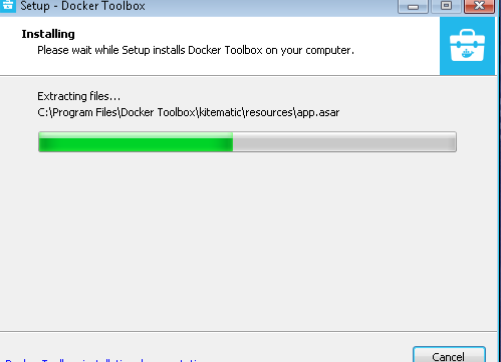
After downloading it, you run DockerToolbox-
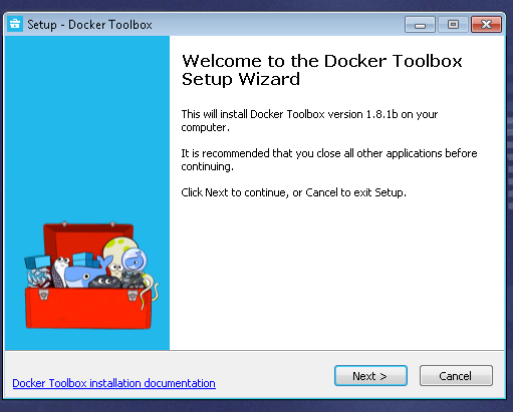
It will handle almost everything for you. You can be asked for Administrator privileges during the installation.
After some time, kitematic will launch and start to install VirtualBox :
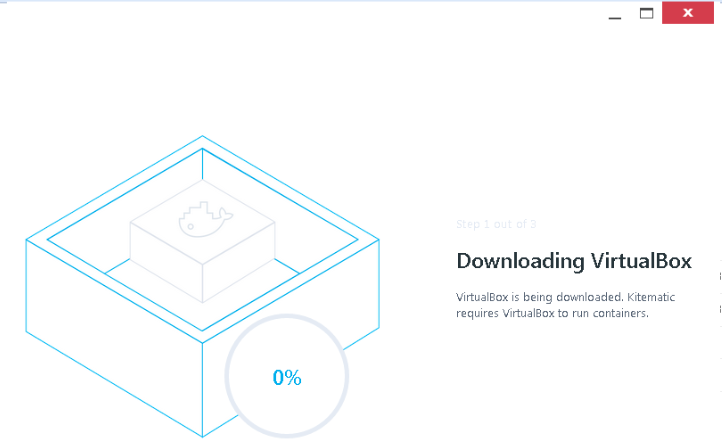
Again you can be asked for permissions to install. But it worked very smoothly for me. And I was doing my installation under a virtualized windows under KVM.
After some time kitematic should have installed and started the boot2docker VM and you will see this screen :
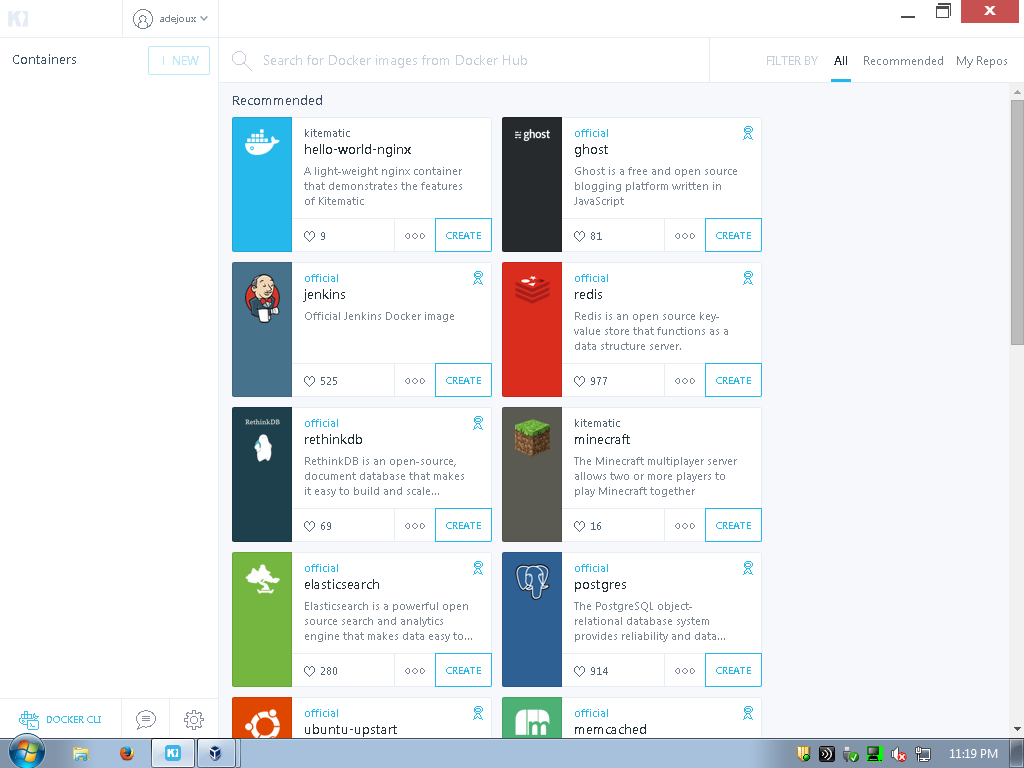
Grafana and InfluxDB container installation
Here you have the choice. You only need to have Grafana and InfluxDB running so choose the container you want.
At the time, I write this article you need to have InfluxDB 0.9 and Grafana 2.1 versions at minimum.
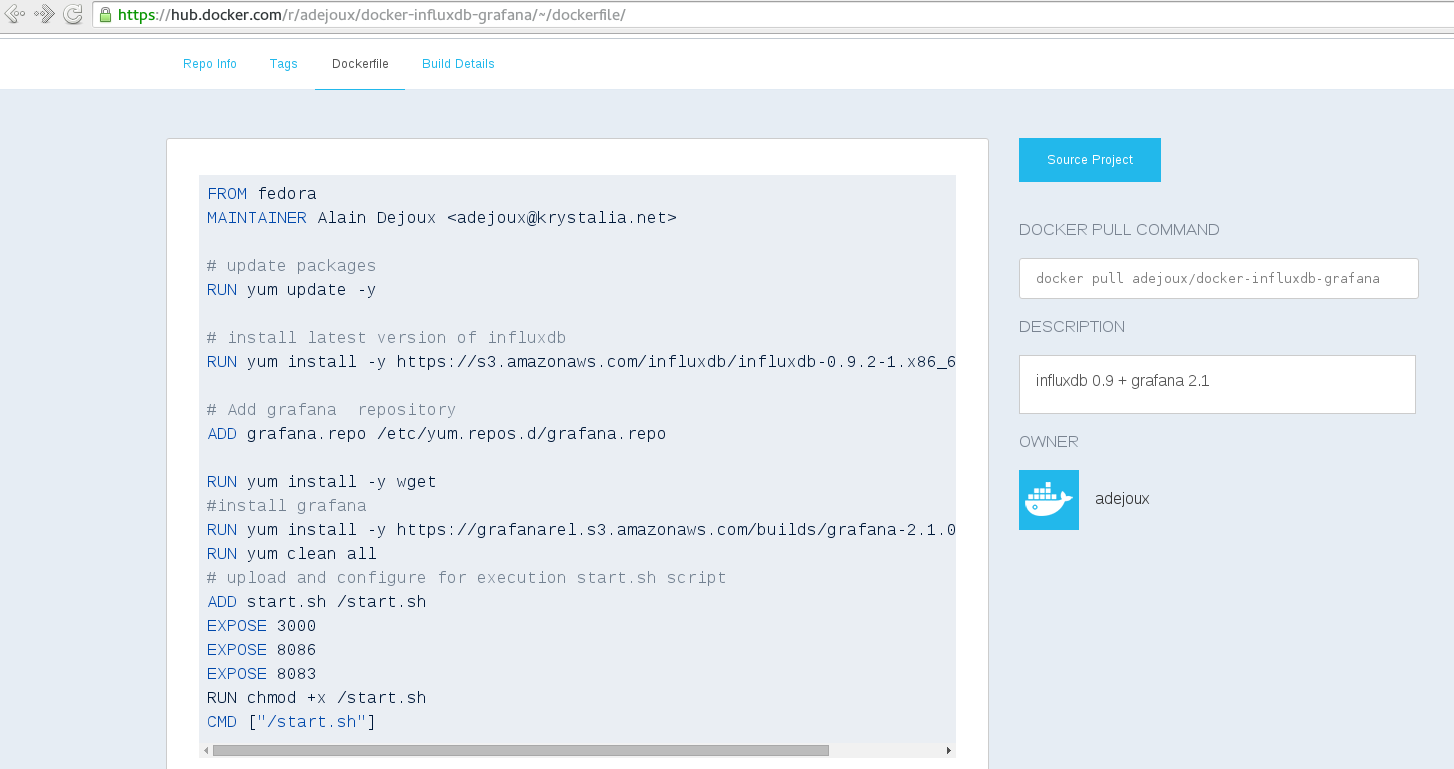
I made available an automated build on docker hub :
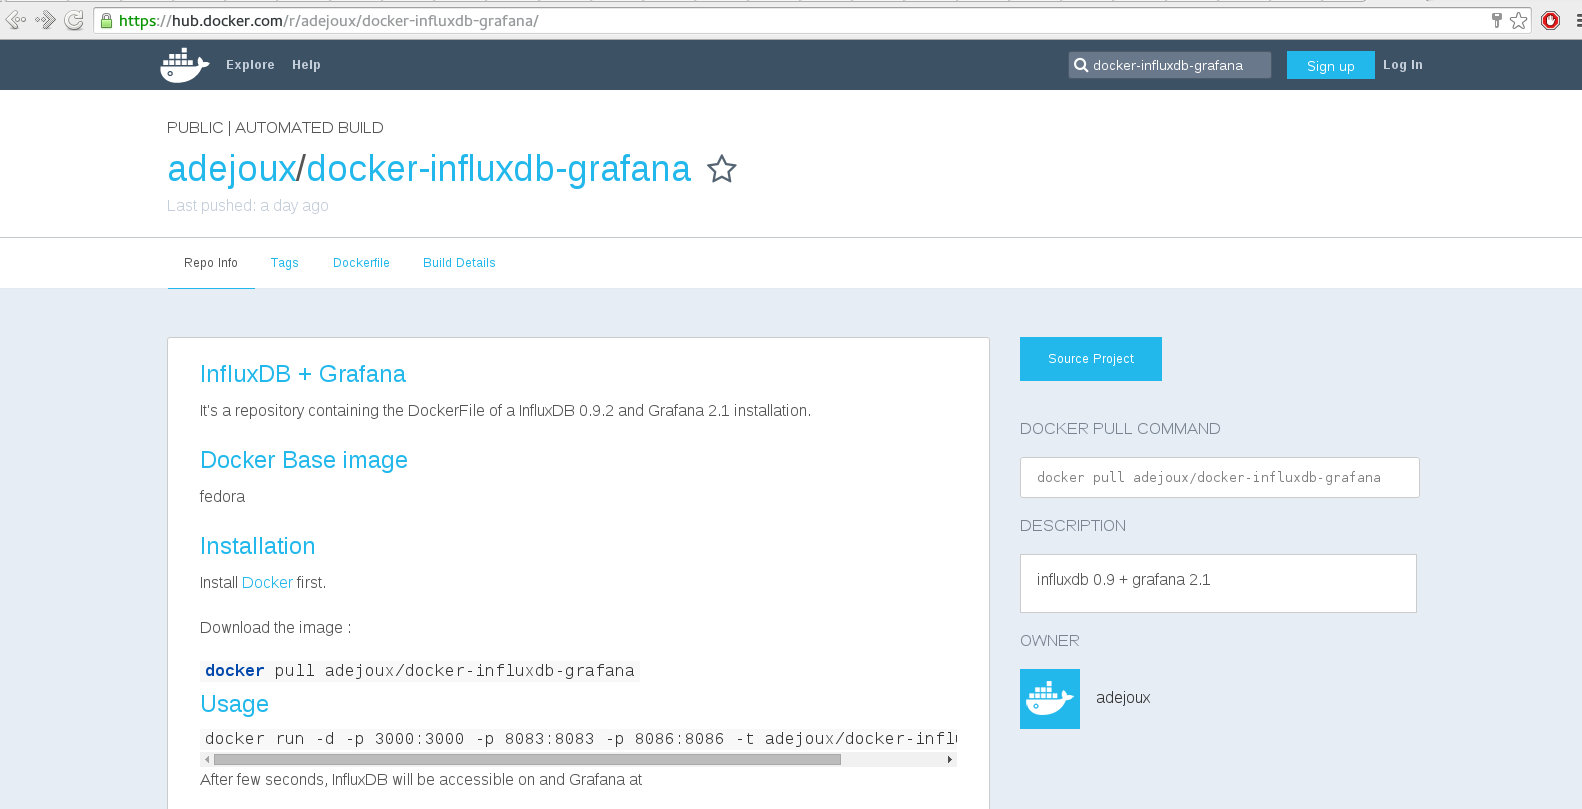
The Dockerfile is pretty simple and you are sure the image was built using it.
You can install it directly from kitematic :

And you will have a container running both InfluxDB and Grafana :
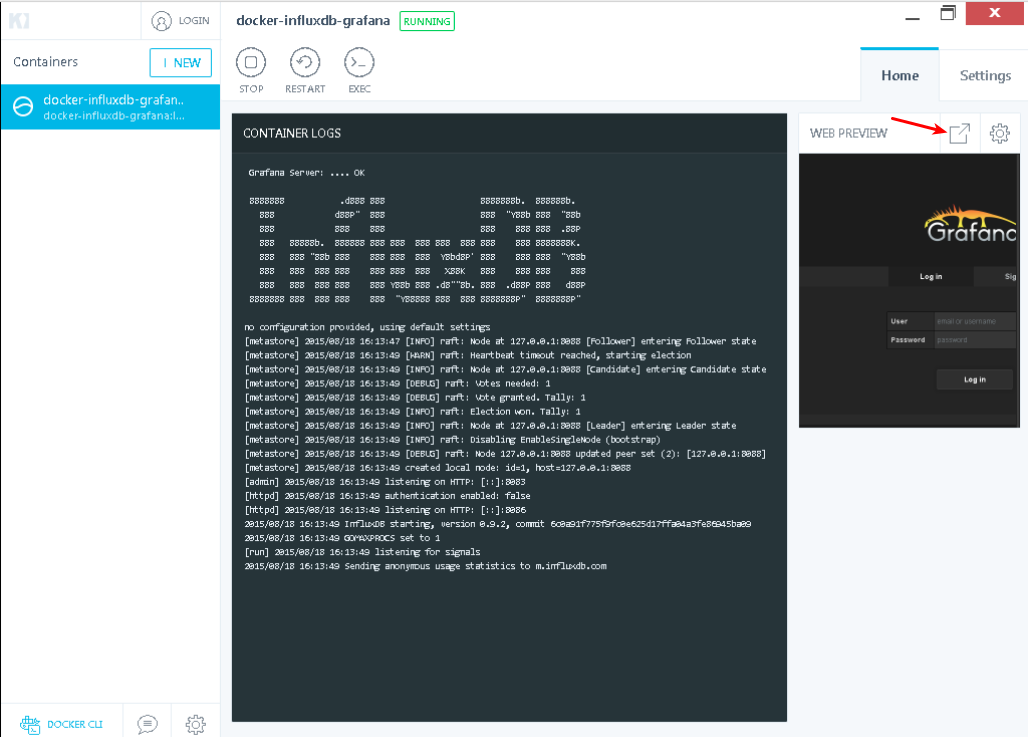
By clicking on web preview, you will access Grafana login page. Default account is admin, pssword is admin.
kitematic is nice but it’s mapping the container’s port randomly.
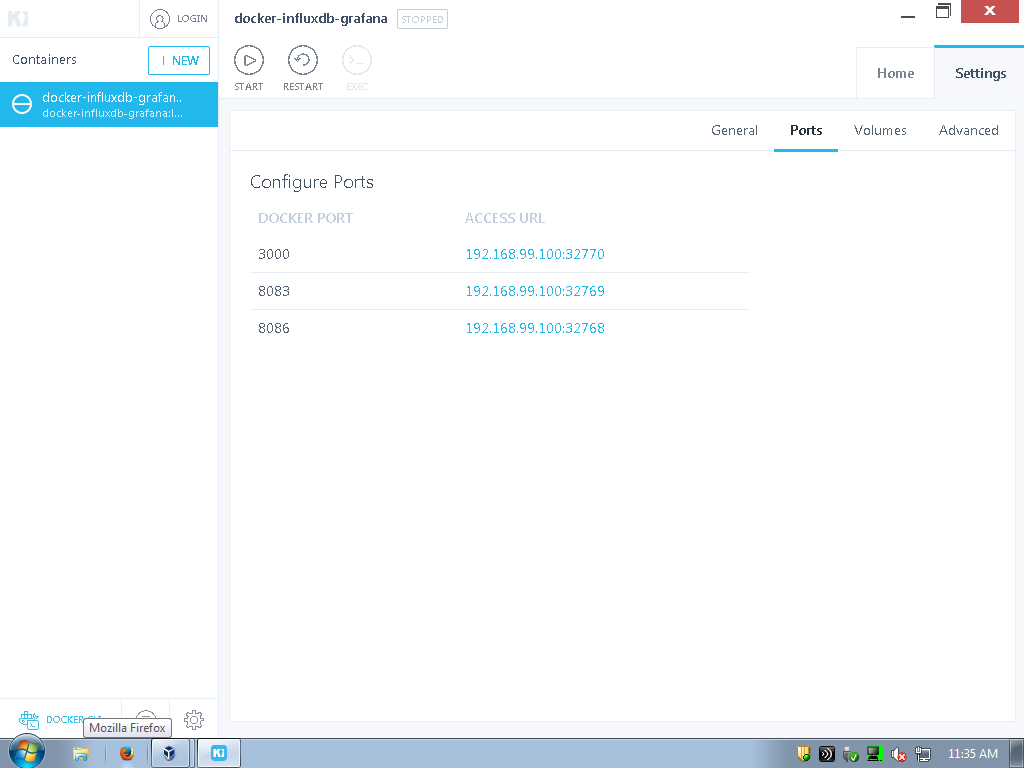
It’s only performed at the container’s creation and it will not change during the container’s life so it’s not really a issue but if it’s bothering you, you can go to the boot2docker VM in VirtualBox. It’s named default. Here you use docker command line to delete the container and start a new container with the new port mappings :
docker ps
docker rm -f docker-influxdb-grafana
docker run -d -p 3000:3000 -p 8083:8083 -p 8086:8086 --name="nmon_reports" -t adejoux/docker-influxdb-grafana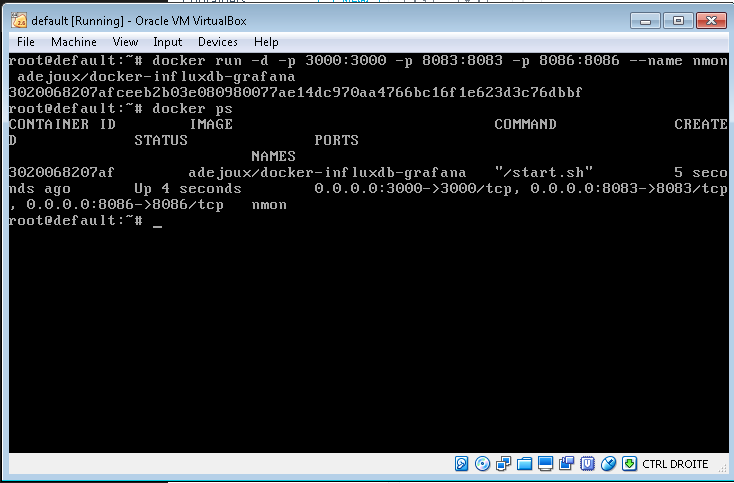
kitematic will be able to manage the new container without problem.
For information, a pull request has been submitted : kitematic issue 598. So it should be solved in the near future.
Using nmon2influxdb
You can use the nmon2influxdb binary file from windows command line tool.
The main difference with running it on linux is you will need to specify the url to access Grafana and the server and port to access the InfluxDB database.
For example, importing a nmon file will be :
nmon2influxdb-windows-amd64.exe -s 192.168.99.100 import vios1_150706_1552.nmonFor dashboard, you will need both InfluxDB and Grafana parameters the first time. It’s because the tool will create the DatSource if it’s not existing :
nmon2influxdb-windows-amd64.exe dashboard file --gurl http://192.168.99.100:3000 vios1_150706_1552.nmon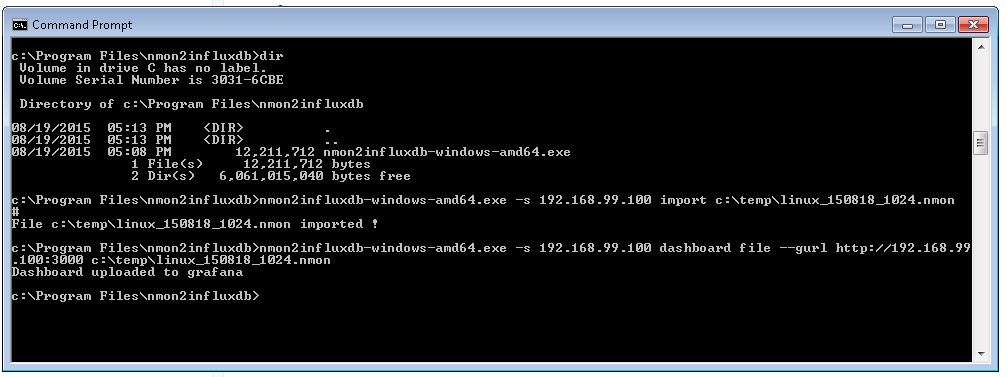
I provide sample nmon reports here.